Introduction
Chronic myeloid leukemia (CML) is a myeloproliferative neoplasm characterized by the dysregulated production and uncontrolled proliferation of mature and maturing granulocytes with fairly normal differentiation. The hallmark of CML is BCR-ABL1 (breakpoint cluster region gene-Abelson murine leukemia viral oncogene homolog 1) on Philadelphia chromosome, which is the result of a reciprocal translocation between the long arms of chromosomes 9 and 22 (t[9;22][q34;q11]).
With rare exceptions, breaks in chromosome 22 localize to one of three BCRs and determine the portions of BCR retained in the BCR-ABL1 fusion mRNA and protein. In contrast, the chromosome 9 breaks can occur over a large genetic region, 5′ of ABL1 exon Ib, 3′ of ABL1 exon Ia, or most commonly between the two alternative first ABL1 exons. In an overwhelming majority of CML patients, the break occurs in the major BCR (M-BCR), generating e13a2 or e14a2 fusion mRNAs and a p210BCR-ABL fusion protein. p230BCR-ABL, the largest of the fusion proteins, corresponds to a break in the micro BCR (μ-BCR), an e19a2 fusion mRNA, and is associated with neutrophilic predominance and possibly less aggressive disease.
Molecular monitoring of BCR-ABL1 transcript levels following treatment with tyrosine kinase inhibitors (TKIs) is central to the effective clinical management of patients with CML. BCR-ABL1 transcripts measured at standardized time points is used to define responses at key milestones in treatment allowing early signs of poor adherence or resistance to treatment to be detected and allow for early, effective clinical intervention.
Objective
The aim of this study is to evaluate response to treatment with standard dose TKI in obese and non-obese CML patients together with BCR-ABL1 transcript type
Methodology
A retrospective analysis of clinicopathological variables and response to treatment was performed for 37 chronic phase CMLs to compare, obese vs normal weight, and BCR-ABL1 transcript type determined at diagnosis. Patients' management and response assessment was done based on ELN 2013 guidelines. Response to treatment was assessed using RT-qPCR analysis of blood calculated on the International Scale (IS). Various statistical methods used, all Statistical analyses were done using statistical packages SPSS 22.0 (SPSS Inc. Chicago, IL) and Epi-info (Centers for Disease Control and Prevention, Atlanta, GA) software.
Results
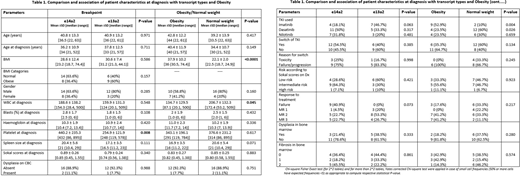
The study cohort included 26 males (70.3%) and 11 females (29.7%) with mean age at diagnosis 36.8 years. 59.5% (n=22) expressed an e14a2 transcript, and 40.5% (n=15) an e13a2 transcript, most patients were started on imatinib, then switched either due to toxicity or failure.
Median follow-up was 18 months for both transcript types.
WBC, platelet counts, spleen size and Sokal scores at diagnosis, both median and Inter-quartile range (IQR) were observed to be higher in e14a2 compared to e13a2 transcript group, and, lower in obese patients compared patients with normal weight.
At one year, patients with e13a2 transcript had higher percentage of CCyR (or better) 60% (95% CI 36.6, 80.3%) compared to e14a2 group 46.7% (95% CI 24.8, 69.9%), however this difference was statistically insignificant (odds ratio =1.71, 95% CI 0.40, 7.29; P=0.464)
Overall, there was higher and faster achievement of CCyR and MMR in patients with e13a2 transcript compared to e14a2 transcript, and in the obese vs normal-weight patients. Patients in e13a2 group and obesity group had a lower rate of treatment failure and fewer indications to switch TKI.
Of note MMR was observed to be significantly higher in patients of African origin (n=10) compared to patients with Asian ethnicity (50% vs 16%; P=0.038), which could be reflect differences in disease biology.
Conclusion
In the patient cohort studied an e14a2 BCR-ABL1 transcript type / normal body weight was associated with an inferior outcome when compared to e13a2 transcript / obesity groups
No relevant conflicts of interest to declare.
Author notes
Asterisk with author names denotes non-ASH members.


